Wednesday, April 9, 2014

E-Mail Forensics

We all have to deal with bogus e-mail from time to time. Following on the last post referencing e-mail security, where you can rely on domain keys and the sender policy framework to ensure you are getting e-mail from the right source, this is all about tracking the bad guys through the network. Okay, maybe not that exciting. At a minimum, this will certainly help you determine whether e-mail can be trusted or not. While there are a lot of technologies that might eventually give us a world where we don’t have to worry about spam and phishing attempts from untrusted sources, the reality is that most businesses are not implementing DomainKeys Identified Mail (DKIM) or Sender Policy Framework (SPF). Until such a time as e-mail security becomes a priority around the world, we will continue to have to deal with e-mail being an open communication mechanism, meaning any system around the world can send to any mail transport agent (MTA). This means e-mail from untrusted sources, spam and various other unwanted garbage in our inbox. 

Since I have had my e-mail address for a lot of years and it happens to be a pretty popular one for jokesters to use when they don’t want to use their own. Personally, I often fill in foo@foo.com or even something like nunyer@beezwax.com if I’m asked for an e-mail address that doesn’t matter and they aren’t going to send a confirmation e-mail to. Because of these two factors, I get a lot of junk e-mail so I have a lot of fun messages to choose from. Picking one at random that is offering me a way to look as good as Martha Stewart who is more than 20 years older than me, I have a set of headers to play with. You can see them below and while you can see the entire chain of receipt headers, I have removed my e-mail address. No offense, but I don’t trust anyone. It’s something of an occupational hazard. 

Screen Shot 2014 04 09 at 2 55 49 PM

It would be nice to find where this message came from. While it can be challenging because there isn’t much in the way of actual verification done with e-mail systems, we can get close or at least find places we can dig a little further. The first place to start is the Received header at the bottom of the pile. This is the very first MTA that has touched this message. When we connect to a mail server, the protocol specifies that we indicate who we are. The mail server will track that information as well as the Internet Protocol (IP) address that the connection is received from. The first part of a message dialog, speaking Simple Mail Transport Protocol (SMTP) is as follows:

220 dallas ESMTP Postfix (Ubuntu)

EHLO blah.com

250-dallas

250-PIPELINING

250-SIZE 10240000

250-VRFY

250-ETRN

250-STARTTLS

250-ENHANCEDSTATUSCODES

250-8BITMIME

250 DSN

MAIL From:foo@foo.com

250 2.1.0 Ok


When I use EHLO, which is HELO for extended SMTP, I am just saying hi to the mail server and introducing myself. The mail server keeps track of who connects so they know what IP address I am really coming from, regardless of whether I tell the truth about the hostname I am. In the transaction above, you can see that I am telling the mail server that I am coming from blah.com, which is obviously untrue. Checking the mail server logs, I can see the IP address that the connection actually came in from. 

Apr  9 15:43:52 dallas postfix/smtpd[9931]: connect from unknown[10.0.0.13]


The example above is from my own internal network. In the case of the headers from the e-mail we are using as an example, we are looking for information about the address 173.0.145.21. The first thing I want to do is see whether the IP address has a hostname associated with it. We want to look up the PTR record in the domain name system (DNS). Best e-mail practice is to have the reverse DNS match the forward. So, if miho.ribefsfield.com resolves to 173.0.145.21 then 173.0.145.21 should resolve to miho.ribefsfield.com. We want to check to see whether that’s the case and whether either of them actually resolve to anything. 

kilroy@dallas /var/log $ host 173.0.145.21

;; connection timed out; no servers could be reached


Turns out we couldn’t find the name server that was supposed to own the IP block this address came out of. Since that’s the case, we can’t do a reverse DNS lookup on the IP. This doesn’t exactly bode well for verifying the source of this e-mail. Let’s see what the hostname that was offered up resolves to. 

kilroy@dallas /var/log $ host miho.ribefsfield.com

miho.ribefsfield.com has address 66.78.32.6


Well, 66.78.32.6 is an entirely different IP address altogether. At this point, we should probably check to see who owns the domain name. Skipping a lot of the preamble from the whois lookup, we get the following information from the regional Internet registries. 

Registrant Email: WEBMASTER@NIZMEDIAGROUP.NET

Registry Admin ID: 

Admin Name: WEB MASTER

Admin Organization: -

Admin Street: 37 TOWER LANE

Admin City: WILLISTON

Admin State/Province: VT

Admin Postal Code: 05495

Admin Country: US

Admin Phone: +1.88888888


The funny thing about this is that I’ve been digging around a lot in e-mail over the last few weeks for a variety of reasons. It seems like every spam message I look at ends up resolving to a domain that is registered to this physical address. The peculiar thing is that this address is a town over from where I am sitting as I write this. You can check any map server you like and you’ll find that it’s a blue house. Google Maps shows that there is a Saturn in the driveway. At some point, it may be entertaining to do a little drive by and see what else is going on but before that, let’s keep going with this e-mail. The hostname referred to in the message actually exists and it resolves to 66.78.32.6. We should check to see who actually owns that IP block and see if it matches anything that we have seen so far. When I run a whois on that IP address, I find that it is part of a pretty big block of addresses (63.78.0.0/18) belonging to Virtual Development Inc. 

OrgName:        Virtual Development INC

OrgId:          VDI

Address:        590 Bloomfield Ave 

Address:        Suite 317

City:           Bloomfield

StateProv:      NJ

PostalCode:     07003

Country:        US

RegDate:        1999-10-21

Updated:        2013-03-07

According to Manta, VDI is a two person shop but there doesn’t appear to be a Web site associated with it, in spite of the enormous block of IP addresses that is registered to it. So far, we have locations in Williston, VT and Bloomfield, NJ. Let’s see if we can add any additional locations to this little tangled Web we have uncovered. We can perform a traceroute to the original IP address from the e-mail headers. Below you will see the last part of the traceroute to the IP address. The suspense is likely killing you at this point. 

12  hurricane-ic-138359-sjo-bb1.c.telia.net (213.248.67.106)  103.452 ms  104.842 ms  167.425 ms

13  10ge1-4.core1.sjc1.he.net (72.52.92.117)  158.437 ms  170.045 ms  170.470 ms

14  evernet-hosting.gigabitethernet2-2.core1.sjc1.he.net (216.218.196.6)  161.826 ms  162.256 ms  162.262 ms


It dead ends at this point. The IP address can not be reached. Interesting that we have added in another player and not one that surprises me. As I said, I’ve been grubbing around through e-mail headers for the last couple of weeks and our good friends at Evernet Hosting are quite familiar to me. Either they are a breeding ground for spammers or else their systems are so badly secured that they are easily compromised. Either way, there is a pretty solid connection between Evernet Hosting in San Jose and a small house in Williston, VT since much of the spam messages where a domain is registered to the Williston address actually originates in San Jose, CA with an IP address somewhere behind Evernet Hosting. Doing a geographic lookup from the IP address reveals that the IP is located in San Jose, CA, just as the traceroute indicates. 

While we don’t have anything specific in terms of a name or even a clearcut company we could point to, we certainly have a lot of clues and from a legal standpoint, we have some places we could look further, as long as we had some legal support. We could check with Evernet Hosting or Virtual Development, Inc just as a starting point. While not immediately satisfying, it’s a step along the path. 

Monday, April 7, 2014

We Now Pause For This Commercial Advertisment

In the spirit of full disclosure, with apologies to RFP, this is as much about propaganda for an upcoming book about cloud computing done securely as it is about much of anything technical. I will say, however, in the process of writing the book, I learned a lot about really cool things that can be done with cloud computing providers. At the risk of giving away the contents of the book, let me pass along a few things that you might think about when it comes to moving your sensitive infrastructure off to become someone else’s problem. I often find someone else’s problems to be very good things and if you plan well, you can get a lot of benefit without a lot of risk. 

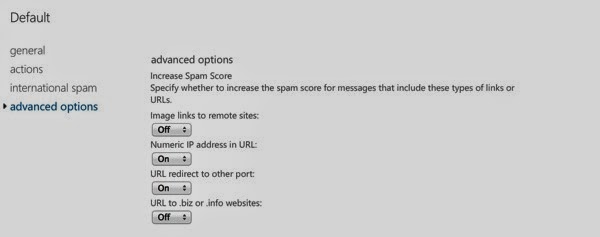
While the infrastructure for my own business domain is hosted with Microsoft, using their Office 365 plan, which has a lot of benefits, not the least of which is a subscription to the Office software for up to 5 computers. This also includes SkyDrive, now called OneDrive, so I can store documents with a storage provider while also being able to edit them through a Web interface. On top of that, I can access documents from wherever I am and share them with other people. All of the benefits of cloud storage that we all know and love so well. In addition to the storage, of course, I get Web hosting and e-mail. As with many other e-mail providers, Microsoft takes care of spam for you but they also provide organizations with settings where you can fine tune how they detect spam. You can see some of those settings below. 

Screen Shot 2014 04 07 at 7 42 01 PM

One thing they don’t handle, however, is the ability to support Domain Keys Identified Mail (DKIM) or the Sender Policy Framework (SPF). DKIM allows organizations to take ownership of e-mail messages. This uses header fields in the e-mail messages that associate a cryptographic key with a domain. If the right key isn’t in place, the message didn’t come from the right place. With SPF, a mail administrator can create a record in the domain name system (DNS) entries for the domain and if a mail transport agent (MTA) receives a message from a host that doesn’t match up with the domain SPF record, it’s likely spam. If it’s spam, the MTA can safely drop it or at least place it into a junk folder for the user to determine whether they really want to look at it or not. 

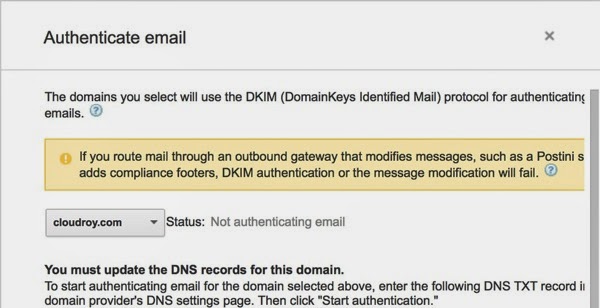
Microsoft’s settings don’t actually give me specific settings for either DKIM or SPF so I don’t have any control over whether they use it or not or what I might use for settings for either of those features. In the course of researching for the book, though, I did some investigation into Google’s offerings for businesses and discovered some interesting things. Again, you can read about this in more detail, but if you get Google Apps for Business, you will get some additional control over your e-mail settings. You can create a key that can be used for DKIM. You can see the settings, or at least a portion of the settings since it doesn’t render in the window correctly and is cut off on the right hand side, below. 

Screen Shot 2014 04 07 at 8 24 40 PM


Once I have the correct setting in my domain name server, recipients can verify that messages they have that appear to be from me are actually from me. Google will also use SPF to help protect recipients. The one thing I don’t get as well with Google that I had with Microsoft was fine grained settings over spam and how it’s filtered. 

In the process of writing the book, I put together a whole domain with Web site and e-mail just to walk through how it would work and also have a Web site related to the book when it was all over. The domain I created is cloudroy.com and it has additional information about the book. There is also a link back to this blog so now I have linked the two completely together. 

Monday, March 31, 2014

Analyzing a Linux Memory Dump

Earlier, we talked about different techniques that could be used to extract memory from a Linux system. At this point, we have a memory dump, though we are still missing something when it comes to being able to analyze it. Virtuality requires some awareness of how the memory is laid out. With Windows, this is well documented and Virtuality includes profiles for different types of Windows installs between processor architectures and version of Windows. The thing about any type of memory forensics is that you need to know where everything is. When it comes to Linux, different versions of the Linux kernel and different kernel parameters may lead to a different layout of the memory space. The only way to determine the memory layout is to take a look at the memory map. 

A map is a symbol table indicating where in memory to locate a particular function. The memory map includes the address, the type of entry it is and name of the entry. You can see an example of a memory map from a Linux Mint installation on a 64-bit system running a 3.11 kernel. 

c1a3d180 d cpu_worker_pools

c1a3d600 D runqueues

c1a3dc00 d sched_clock_data

c1a3dc40 d csd_data

c1a3dc80 d call_single_queue

c1a3dcc0 d cfd_data

c1a3dd00 D softnet_data

c1a3ddc0 D __per_cpu_end

c1a3e000 D __init_end

c1a3e000 R __smp_locks

c1a45000 B __bss_start

c1a45000 R __smp_locks_end

c1a45000 b initial_pg_pmd

c1a46000 b initial_pg_fixmap

c1a47000 B empty_zero_page

c1a48000 B swapper_pg_dir

c1a49000 b dummy_mapping

c1a4a000 B idt_table

c1a4b000 B trace_idt_table

c1a4c000 b bm_pte

c1a4d000 B initcall_debug

c1a4d004 B reset_devices

c1a4d008 B saved_command_line

c1a4d00c b panic_param


You can see three columns in this memory map. The first is the address in memory that the entry can be located. The second is the type of entry that it is. While there are a number of different types of memory segments, some of the types you will run into in a system.map file on a Linux system are as follows:

A is an absolute location
B or b is an uninitialized data segment, referred to as BSS and a stack segment
D or d for an initialized data segment
G or g for a global segment of initialized data which may be thought of as a heap
R or r for read only data segments
T or t for text segments, which is where executable code is stored
U for undefined
W or w for weak objects that have not been tagged as weak objects

You can see from the listing above that we have some stack segments and some initialized data segments from the short sample of the system.map file from this one system. This system.map file would be required to create a profile that we can use with Volatile to analyze the memory dump we have created. We also need additional data, though. We need some debugging information, which leads to another package that needs to be installed. The package is based on DWARF, a debugging format. On Ubuntu and systems that are based on it, the package is called dwarfdump. This will provide us with additional information Volatility needs to be able to extract the relevant pieces from the memory dump. Once dwarfdump is installed, we can build the module. In tools/linux inside the Volatility source tree, you run make and that will create a module.dwarf. You can see the process below as well as the dwarf.module that we will need. 

kilroy@quiche:~/volatility-2.3.1/tools/linux$ make 

make -C //lib/modules/3.11.0-12-generic/build CONFIG_DEBUG_INFO=y M=/home/kilroy/volatility-2.3.1/tools/linux modules

make[1]: Entering directory `/usr/src/linux-headers-3.11.0-12-generic'

  CC [M]  /home/kilroy/volatility-2.3.1/tools/linux/module.o

  Building modules, stage 2.

  MODPOST 1 modules

  CC      /home/kilroy/volatility-2.3.1/tools/linux/module.mod.o

  LD [M]  /home/kilroy/volatility-2.3.1/tools/linux/module.ko

make[1]: Leaving directory `/usr/src/linux-headers-3.11.0-12-generic'

dwarfdump -di module.ko > module.dwarf

make -C //lib/modules/3.11.0-12-generic/build M=/home/kilroy/volatility-2.3.1/tools/linux clean

make[1]: Entering directory `/usr/src/linux-headers-3.11.0-12-generic'

  CLEAN   /home/kilroy/volatility-2.3.1/tools/linux/.tmp_versions

  CLEAN   /home/kilroy/volatility-2.3.1/tools/linux/Module.symvers

make[1]: Leaving directory `/usr/src/linux-headers-3.11.0-12-generic'

kilroy@quiche:~/volatility-2.3.1/tools/linux$ head module.dwarf 


.debug_info


<0><0x0+0xb><DW_TAG_compile_unit> DW_AT_producer<"GNU C 4.8.1 -m32 -msoft-float -mregparm=3 -mpreferred-stack-boundary=2 -march=i686 -mtune=generic -maccumulate-outgoing-args -mno-sse -mno-mmx -mno-sse2 -mno-3dnow -mno-avx -g -O2 -p -fno-strict-aliasing -fno-common -fno-delete-null-pointer-checks -freg-struct-return -fno-pic -ffreestanding -fstack-protector -fno-asynchronous-unwind-tables -fno-omit-frame-pointer -fno-optimize-sibling-calls -fno-strict-overflow -fconserve-stack"> DW_AT_language<DW_LANG_C89> DW_AT_name<"/home/kilroy/volatility-2.3.1/tools/linux/module.c"> DW_AT_comp_dir<"/usr/src/linux-headers-3.11.0-12-generic"> DW_AT_stmt_list<0x00000000>

<1><0x1d><DW_TAG_typedef> DW_AT_name<"__s8"> DW_AT_decl_file<0x00000001 include/uapi/asm-generic/int-ll64.h> DW_AT_decl_line<0x00000013> DW_AT_type<<0x00000028>>


We now need to create the profile we are going to use before we can actually spin Volatility up. We need to zip up the Dwarf module and the system.map for the system that we gathered the memory dump from. In my case, I am going to use the command zip LinuxMint.zip tools/linux/module.dwarf /boot/System.map-3.11.0-12-generic and that will result in the profile I need. In order to get Volatility to find it, though, we need to put it in the right place. If I were running volatility from the directory that was created when I extracted the tarball,I would put the resulting .zip file into volatility/plugins/overlays//linux. However, if I have gone through the process of installing Volatility after making it, I need to put the resulting zip file into /usr/local/lib/python2.7/dist-packages/volatility-2.3.1-py2.7.egg/volatility/plugins/overlays/linux. This is where Volatilty looks to find the profiles for Linux systems. Once we have it in place, we can verify that Volatility has found it by running vol.py —info and looking for Linux, as seen below. 

kilroy@quiche:~$ vol.py --info | grep Linux

Volatility Foundation Volatility Framework 2.3.1

LinuxLinuxMintx86 - A Profile for Linux LinuxMint x86

linux_banner            - Prints the Linux banner information

linux_yarascan          - A shell in the Linux memory image

 
Based on the name LinuxMint.zip that I gave to the file, Volatility has prepended linux onto it as a profile name because the profile is in the linux folder. The profile name turns into linuxLinuxMint. Now we have a profile and a memory dump file, so we can do a little digging into the memory. The first thing we need to do is figure out what commands we can use. Running vol.py yields a list of commands that are targeted at Windows profiles. In order to get the list of Linux-related commands, we have to run vol.py —info which shows up as an option if you run vol.py -h. Now that we have a list of things we can do, let’s dig into the memory dump we previously obtained. The capture below, showing a couple of commands, is taken from a 64-bit system running Kali Linux. 
 

root@quiche:~# vol.py linux_banner --profile=LinuxSystemx64 -f linux.dd 

Volatility Foundation Volatility Framework 2.3.1

Linux version 3.7-trunk-amd64 (debian-kernel@lists.debian.org) (gcc version 4.7.2 (Debian 4.7.2-5) ) #1 SMP Debian 3.7.2-0+kali8

root@quiche:~# vol.py linux_ifconfig --profile=LinuxSystemx64 -f linux.dd

Volatility Foundation Volatility Framework 2.3.1

Interface        IP Address           MAC Address        Promiscous Mode

---------------- -------------------- ------------------ ---------------

lo               127.0.0.1            00:00:00:00:00:00  False          

eth0             10.0.0.182           00:00:00:00:00:00  False          

 
While these commands are not all that impressive in terms of useful data, they do show that we can extract information from the system dump. There are a lot of other commands we can perform against the memory dump that could be used to extract data from running memory. Perhaps this next example will be more intriguing to you. This is a list of shell commands that have been run. They have been extracted from the memory dump. There is absolutely no question that this is a list of commands that I have run on the system where the memory was captured. The command time is a little more specious and it seems to reflect the date and time that the capture was created, more than the time and date the command was created. 
 

root@quiche:~# vol.py linux_bash --profile=LinuxSystemx64 -f linux.dd

Volatility Foundation Volatility Framework 2.3.1

Pid      Name                 Command Time                   Command

-------- -------------------- ------------------------------ -------

    3577 bash                 2014-04-01 00:11:43 UTC+0000   cd /media/cdrom/

    3577 bash                 2014-04-01 00:11:43 UTC+0000   ls /etc/init.d

    3577 bash                 2014-04-01 00:11:43 UTC+0000   ifconfig -a

    3577 bash                 2014-04-01 00:11:43 UTC+0000   cd

    3577 bash                 2014-04-01 00:11:43 UTC+0000   rm -Rf installer

    3577 bash                 2014-04-01 00:11:43 UTC+0000   ls

    3577 bash                 2014-04-01 00:11:43 UTC+0000   cd 

    3577 bash                 2014-04-01 00:11:43 UTC+0000   netdiscover

    3577 bash                 2014-04-01 00:11:43 UTC+0000   rm install

    3577 bash                 2014-04-01 00:11:43 UTC+0000   rm -Rf kmods

    3577 bash                 2014-04-01 00:11:43 UTC+0000   sh install

    3577 bash                 2014-04-01 00:11:43 UTC+0000   cp -Rf * ~

    3577 bash                 2014-04-01 00:11:43 UTC+0000   shutdown -r now

    3577 bash                 2014-04-01 00:11:43 UTC+0000   rm -Rf tools

    3577 bash                 2014-04-01 00:11:43 UTC+0000   ls

    3577 bash                 2014-04-01 00:11:43 UTC+0000   shutdown -h now

    3577 bash                 2014-04-01 00:11:43 UTC+0000   ifconfig -a

    3577 bash                 2014-04-01 00:11:43 UTC+0000   ./install

    3577 bash                 2014-04-01 00:11:43 UTC+0000   rm install-gui 

    3577 bash                 2014-04-01 00:11:43 UTC+0000   ./install

    3577 bash                 2014-04-01 00:11:43 UTC+0000   ls

    3577 bash                 2014-04-01 00:11:43 UTC+0000   shutdown -h now

    3577 bash                 2014-04-01 00:11:43 UTC+0000   ls

    3577 bash                 2014-04-01 00:11:43 UTC+0000   rm version

    3577 bash                 2014-04-01 00:11:43 UTC+0000   ls

    3577 bash                 2014-04-01 00:11:43 UTC+0000   clear

    3577 bash                 2014-04-01 00:11:43 UTC+0000   sudo nmap -sS -O -T 4 172.30.42.41

 
The interesting thing about this is the process id shown in this list appears to be the same across all of the commands in the list. Checking the system itself, there is a process that has that particular pid and the process is a bash process. The commands were not all run from that bash session, though, but clearly the shell loads all of the history into memory for use. I can also check the memory dump to see if there was a process with the pid 3577. I would use the linux_pslist command to look for that process. That command will show us the list of processes that were running at the time the capture was created. Searching through the list of processes can be a very time consuming task. Running linux_pstree is much faster. You can see the output below showing the process tree that includes the bash process with a pid of 3577 that had the history loaded up into it. 
 

.gdm3                2468            0              

..gdm-simple-slav    2474            0              

...Xorg              2482            0              

...gdm-session-wor   3219            0              

....x-session-manag  3256            0              

.....ssh-agent       3317            0              

.....gnome-settings- 3326            0              

.....metacity        3361            0              

.....gnome-panel     3375            0              

......gnome-terminal 3570            0              

.......gnome-pty-helpe 3576            0              

.......bash          3577            0              

 
When you run vol.py —info | grep linux, you can see the list of commands you can run, as noted above. You can see that the list is shorter than that of the list of commands available for Windows. One of the most interesting commands available for Windows that, sadly, isn’t available for Linux is the one that extracts files from memory. This difference in the commands available has to do with the way memory is laid out and managed by the operating system. On top of that, Windows is used far more often and there is more call for forensics of Windows systems so it could simply be that there was more development done on the Windows commands and plugins. Whatever the case, Linux has fewer commands that are available but the ones that are available are still very powerful and useful. 

Memory Forensics the Linux Way

Now that we have grabbed a memory dump from a Windows system and used Volatility to extract critical information that would otherwise have been lost if the system had simply been powered down, we should take a look at how to do the same thing in Linux. If you are familiar with Linux, you may recognize that we have one utility already in hand that can do an extraction for us. However, if you have a modern version of the Linux kernel (operating system), we have an issue. Before we get into the problem, we should talk about how we might get access to memory. 

In Linux, every device is easily accessible through the /dev filesystem, which is a pseudo-filesystem populated by the operating system while it’s running. The operating system creates an entry in the /dev tree as a result of device drivers that are either built into the kernel or built as a module that can be loaded and unloaded in the running kernel. Getting access to memory is not different from accessing other devices. In Linux, the memory device is found at /dev/mem and we could use dd to extract data from that device, just as we would with a disk device like /dev/sda. However, in order to protect the memory space, the Linux developers have restricted what we can do to the mem device. One of the reasons is that it’s very easy to really mess up your system. All you’d have to do would be to execute dd if=/dev/urandom of=/dev/mem and you’d quickly have a system that was no longer operational. You can see what happens when we try to get a dump of /dev/mem using dd. 

kilroy@quiche:~$ sudo dd if=/dev/mem of=mem.dump

dd: reading ‘/dev/mem’: Operation not permitted

2048+0 records in

2048+0 records out

1048576 bytes (1.0 MB) copied, 0.0109432 s, 95.8 MB/s


Linux says operation is not permitted and all we get is 1M out of a system that has 2G of memory in it. We need another approach. Fortunately, there are a couple of kernel modules we can get that will give us access to the memory we want. The first one is a simple replacement for mem, without the restrictions that the mem device has. fmem is a kernel module that works well for forensic purposes and it works just like you’d expect it to. Before we can use it, though, we have to get it installed. Below, I have the source code that I have built and I run make install as a superuser to get the module loaded into the kernel. I could have also used insmod. 

kilroy@quiche:~/Downloads/fmem_1.6-1$ sudo make install

./run.sh

Module: insmod fmem.ko a1=0xc1058800 : OK

Device: /dev/fmem

----Memory areas: -----

reg00: base=0x000000000 (    0MB), size= 2048MB, count=1: write-back

reg01: base=0x0b0000000 ( 2816MB), size=    2MB, count=1: write-combining

-----------------------

!!! Don't forget add "count=" to dd !!!


Now we have the module loaded, we can use dd to extract memory and just refer it to the /dev/fmem device. I could set a count on it if I wanted to restrict the amount of memory I get but if I want to get all of memory, I don’t want to use a count. I do, though, set a block size to be higher than the typical block size. This should help dd go faster since it’s reading larger chunks and as a result, does fewer reads. Below, you can see what the process looks like. To extract 2G of memory took a little over 6 seconds, as you can see from the output. 

kilroy@quiche:~$ sudo dd if=/dev/fmem of=linux.dd bs=1M

dd: reading ‘/dev/fmem’: Bad address

2047+0 records in

2047+0 records out

2146435072 bytes (2.1 GB) copied, 6.39649 s, 336 MB/s


fmem is just one possibility. Another possibility is Lime, which can be used for memory extraction from Linux. One of the interesting capabilities of Lime is the ability to capture memory over a network. Lime will startup a server on the target host and when you connect to that server, you will get a stream of the contents of memory. Before we get there, though, we have to build the source tree. While I haven’t mentioned this before, building a Linux kernel module requires a lot of extra packages including the Linux headers. This isn’t something you probably want to do on a system that you are trying to get a forensic image of since you’ll be adding a lot of files and packages just to get this one kernel module installed. Linux kernel modules are not always easy to port from one system to another. For instance, after creating the Lime module, I copied it over to another system and tried to install it without success. Building a portable kernel module is a topic for another day, however. Once we have the module built, we have to install it. Lime installation, unlike fmem, requires parameters so you can indicate how you want to acquire the image. In this case, we’re just going to write it out to disk. 

kilroy@quiche:~/lime/src$ sudo insmod lime-3.11.0-12-generic.ko "path=lime.dump format=lime"

kilroy@quiche:~/lime/src$ ls -la lime.dump

-r--r--r-- 1 root root 2147019840 Mar 31 08:52 lime.dump


If I wanted to open up a network listener so I could use netcat to get the image, I would change the parameter to path=tcp:4500. Using netcat, I could then use nc 10.0.0.8 4500 > lime.dump to get the image out. This can be very convenient if you don’t have enough disk space on the target or if you want to leave the disk as it is as much as possible. Once we have the image, we can use Volatility on it, right? Well, not necessarily. We have to create a profile for Volatility. I’ll take that up as a separate topic along with using Volatility on a Linux memory dump. Stay tuned for that. 

Thursday, March 27, 2014

Memory Forensics (the first in a series?)

One of the most interesting places to find operating system artifacts is in memory. We can learn a lot about a user’s behavior by just observing what they have in memory at the time of a system capture. However, acquiring memory isn’t always a walk in the park. This is another area where Windows continues to have an advantage. Sort of. One of the problems Windows has is, in spite of its command line origins (DOS), it doesn’t handle the command line well. One of the areas this shows is its organization of program content. The Program Files directory works well for graphical programs that are and should be self-contained. However, when we are working with the command line, we rely on the PATH environment variable and if I have to add in a long path in the Program Files directory for every program I want to get access to, I have a very long PATH variable. Or, worse, if I have a number of utilities that are single file executables, I have to have the files I work on in the same directory as the executable or else I need to deal with long path names. 

One solution for this is to create a single directory to store a lot of small utilities in. The Windows Sysinternals tools are a great example of small utilities you may want to have access to everywhere. Two more are utilities we will be looking at here. What I did to solve the PATH problem and making sure I could act on a file no matter where it was without having to move executables around was to create a C:\Tools folder and then add that to the PATH variable on the system. You can get to the PATH variable from Advanced System Settings in Computer Properties. 

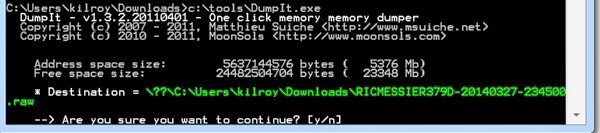
The first tool we need to make use of is the DumpIt tool. The DumpIt tool overcomes a challenge that we have. The challenge is that we shouldn’t be able to get direct access to memory. Memory should be managed by the operating system and we shouldn’t get direct access to it. This is especially true when it comes to writing to memory because you can cause problems if you somehow manage to sidestep the operating system and write directly to memory, you could overwrite critical operating system components or other programs that are executing and cause application of system crashes. It would be nice to keep all of our problems to a minimum and rather than diving into a lecture on the usefulness of separating functions into different rings where ring 0 has the highest level of privileges, we’ll just stick with getting our hands on some memory. We will use the DumpIt program to do that. Fortunately, it’s incredibly easy to use as you can see below. 

Screen Shot 2014 03 27 at 7 45 07 PM


It’s really as simple as running DumpIt and then saying that you really want to continue when it asks you. You will then get a really large file that could be really, really large if you happen to have the kind of system that supports a LOT of memory. I’d say if you were the type of person who had a lot of money and could afford a lot of memory except that the price of RAM is supposed to be dropping, right? Well, at the very least it’s a lot easier and less expensive to get a metric buttload of memory now as compared with, say, the early 80s. Be aware that you need to make sure you have the disk space available to store the contents of your memory. If you have 4 gigabytes worth of memory on your system, you need at least 4 gigabytes of memory available to write to on your disk. 16G, 32G, whatever you have, make sure you have the disk space to store it because it’s all coming down. 

Once we have the memory capture from our running system, you should keep one thing in mind. Whatever else you get from the memory capture, you will definitely get artifacts from your use of DumpIt. In order to get the memory, DumpIt has to execute and in order to execute, it has to be in memory and if it’s in memory, it’s going to show up in the memory dump you are getting. Something to keep in mind. When you run a process list, you’ll see DumpIt in your process list. 

Now that we have a dump of memory, we need a good way of taking a look at it. As much fun as hex editors are, I find it’s difficult to find much of anything in a very large block of memory in a hex editor. We need a utility to automate the process. A utility that understands how memory is structure. A utility that knows where all the skeletons are buried, so to speak. We need Volatility. The Volatility Framework is a way of grabbing a lot of artifacts from a memory capture. In order to do this, though, it needs to know what type of memory capture we have. It uses a set of profiles in order to know what the memory layout looks like and where the different important structures are. We can determine the profile that is in use by using the command volatility imageinfo -f imagename.raw. You can see the output of that below, though I have substituted imagename.raw for the actual name of the image I got. I’m doing the analysis on a 64-bit Windows 7 Pro system, though the memory was captured from a Windows XP Pro system. 

Screen Shot 2014 03 27 at 7 42 16 PM


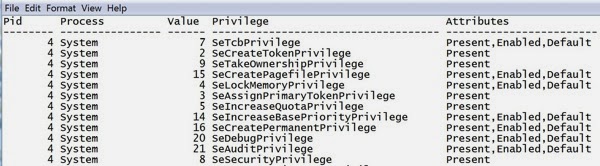
Once we have determined the profile, we can make any additional work much faster by providing the profile to volatility. As an example, we can get a list of the process privileges by using the priv command against our captured memory. This will present a list of the processes that were running when the capture took place and the privileges that are associated with it. In order to get that and also provide the profile, we can run volatility privs —profile=WinXPSP3x86 -f imagename.raw and it will skim through the memory dump, gathering all of that information. One of the problems we have is a limitation of the Windows command prompt and how Microsoft by default only allows 80 characters for the width of the window. You can increase the width, but it requires going into the properties and then dragging the window open. You can’t just drag the window open in Windows 7 and have the window adapt to the new size. Volatility, however, outputs in tables wider than 80 characters so your output will be wrapped, making it harder to read. We can write the output of any command to a text file by using —output-file=filename. You’ll get a text file with all of the relevant details. An example is the data below.

Screen Shot 2014 03 27 at 8 28 24 PM


This output has been truncated in order to better fit in this page. There is, in actuality, a whole other column with a description field that has a text description of the privilege.

While we have done a couple of things to gather information, there is so much more to do but there isn’t as much point in walking through every single command available in Volatility when you can just go get yourself a copy of Volatility and play. Volatility has a number of Windows profiles and the default set of commands is targeted at the Windows profile. However, there are ways to analyze Linux memory captures and capturing Linux memory has its own unique set of challenges. That, however, is another task for another day. 


Tuesday, March 11, 2014

Anti-Forensics Part 1 (Hiding Files in the Registry)

This semester, I’ve been teaching a class on Anti-Forensics, which is a variety of techniques designed to make life difficult for a forensic investigator. The Windows registry is a great place to hide data as it turns out. While it’s stored in plain sight, the registry is such an enormous, convoluted mess that finding a value stored in the registry in an arbitrary place would be just like looking for a needle in a haystack. You could store notes to other people, account numbers, passwords or any number of other pieces of data. You can see the registry editor below and the New menu with key, which is like a folder where you would collect a number of values. These values could be strings, numbers as words, double words or quad words, string collections or just simply binary data. 

Screen Shot 2014 03 11 at 7 58 48 PM


We started down the road of talking about different things you could store in the registry one class period. Once you start thinking about binary data, it’s nearly irresistible to think about stuffing files, particularly executable program files, into a registry key somewhere. There are challenges with using the registry editor to do this, however. You can’t just open an executable file in a hexadecimal editor, copy the contents of the file and then paste the data into a binary value. When you create a binary value and go to plug data into it, you get a dialog box where you can start entering hexadecimal. You can’t Paste. None of the typical pasting techniques (Ctrl-V, right click and select paste and so forth) work. However, there are great application programming interfaces (APIs) that we can use to get access to the registry. The challenge is then to write a program that will take any file as input and stuff it into the registry. I took up the challenge in two programming languages. The first was C#. I mean, why not use Microsoft’s own language to get access to a Microsoft feature. I ran into creeping featurism, however, and though I currently have a working version, I don’t consider it to be complete at this point. The second language was Python. You can see the proof of concept script below. This can be used to store any file into a registry key. 


#  File: reghide.py
#  Author: Ric Messier
#  Description: This program could be used to hide files inside a registry key. 
# While we assume that the key created will be in HKEY_CURRENT_USER\Software,
#it could be anywhere and this script could be edited to reflect that or I 
#could also extend it to make that flexible as well
#  Copyright:  2014, WasHere Consulting, Inc.
 
import _winreg
import sys, os
import argparse
 
# get arguments
argParser = argparse.ArgumentParser()
argParser.add_argument('-f', type=str, help='the file you want to store', required=True)
argParser.add_argument('-v', type=str, help='the name of the value to use', required=True)
argParser.add_argument('-k', type=str, help='the name of the key to use', required=True)
 
passedArgs = vars(argParser.parse_args())
 
keyName = passedArgs['k']
baseName = passedArgs['v']
fileName = passedArgs['f']
 
key = _winreg.CreateKey(_winreg.HKEY_CURRENT_USER, "Software\\" + keyName)
 
#  set the extension to the base value name to 1. This will increase based on the number
#  of chunks read in
currValue = 1
 
#  open the file specified with a bunch of exception handling
try:
with open(fileName) as fileHandle:
#  going to read in 1024 byte chunks
dataChunk = fileHandle.read(1024)
while dataChunk:
#  create a value name from the base name and then a zero filled number
#  appended to it to create unique value names
valName = baseName + str(currValue).zfill(6)
#  set the value in the registry
_winreg.SetValueEx(key, valName, 0, _winreg.REG_BINARY, dataChunk)
#  read another chunk in
dataChunk = fileHandle.read(1024)
currValue = currValue + 1
except IOError as err:
print("I/O error: {0}".format(err))
except:
print("Unexpected error:", sys.exc_info()[0])

Fair warning that stuffing very large files into your registry may cause unexpected consequences. The Python script chunks the data up into 1024 byte chunks meaning that you will end up with a number of values with data in them. You can see some of what that looks like below.

Screen Shot 2014 03 11 at 9 01 05 PM


The one thing missing from this scenario, of course, is a way to extract the file once it’s been stuffed into the registry. Well, that would be a project for another day and it seems like it may require more overhead when it comes to the hiding program. It may be useful to store the filename so when you extract the data, you don’t have to prompt for a new filename. The filename is already there in the registry with all of the bytes from the file. Just get the name back and associate it with the data. 


Monday, February 3, 2014

Net Neutrality

The Internet has no backbone. Let’s get that out of the way right now. If you want to think about it in terms of anatomy, you’re better off thinking about squids or octopi, although those aren’t very good either since there is a central point of “intelligence” in both of those cases. You may be wondering why I’m starting off with such a strong statement, especially without clearly coming up with an apt analogy to replace the backbone one. Let me back up. 

I was invited to discuss the concept of Net Neutrality and the recent ruling by a court striking it down. The invitation came from the local television station WCAX by way of Champlain College. You can watch the brief interview at this link. Net Neutrality is the idea that all traffic that flows across the Internet should be treated equally. What this means is that providers can’t discriminate between one type of application traffic and another. In reality, the Internet Protocol (IP) is designed to do just this and providers have been using one form of it or another for years. They prioritize or may prioritize one type of traffic over another, depending on a variety of factors including customers paying them. Some applications like Skype or Vonage or even Netflix and Amazon Streaming are very time sensitive. It may be helpful to have traffic from those applications get a higher priority over, say, search requests to Google. 

What happened, though, and has been happening is that providers like Comcast have been blocking peer to peer file sharing services like BitTorrents. Before that, it was the file sharing networks behind Limewire and Kazaa. As I said, this has been going on for years. In 2010, our friends at the Federal Candy Company (FCC) decided to actually pass a regulation requiring that providers don’t prefer any application traffic over another. Later, they decided to go after Comcast for blocking file sharing traffic. File sharing traffic has a couple of concerns that are attached to it. The first is the bandwidth that it uses as people are not only downloading but also uploading. The second is that in many cases, the files being shared violate copyright meaning the action is simply illegal. Comcast is less concerned with the legality of the action than they are with the fact that customers are passing a lot of traffic around. 

This is where we circle back to the initial statement that the Internet has no backbone. The Internet is really a very large collection of networks that are connected together. How are they connected together? In some cases, smaller networks pay larger networks to connect with them. This is what we call transit where the smaller company pays the bigger company to carry traffic to other networks for them. If two network providers are roughly the same size, it makes sense for those two providers to just throw a network cable over a wall where they are both located and pass traffic back and forth without any payment involved. This assumes that the two providers are sending more or less the same amount of traffic to one another meaning that there is a benefit to both providers. In some cases, networks that have a lot of content providers like ESPN, Disney, CNN, Facebook or Twitter may find it helpful to connect directly to networks where there are a lot of eyeballs like Comcast or Charter. The provider that has content customers can tell those customers they can get to the eyeballs quickly by connecting directly with the eyeball networks. They get more customers that way. 

We can take a look at something called a traceroute, that shows us the path through the Internet from one location to another. If we look closely at the output from the traceroute, we can see different networks that we pass through. In some cases, you may pass through multiple networks on your way from one to another. In that cases, the middle networks are being used as transit to get from one network to another. In the traceroute output below, we go through Comcast where we started from my laptop and then through Global Crossing (glbx), Hurricane Electric (he) and then to Teljet before getting to our target, which is the mail server at Champlain College. 

 3  te-5-4-ur01.williston.vt.boston.comcast.net (68.87.158.113)  95.746 ms  27.177 ms  24.429 ms

 4  be-79-ar01.needham.ma.boston.comcast.net (68.85.162.45)  25.583 ms  21.388 ms  25.342 ms

 5  he-2-8-0-0-cr01.newyork.ny.ibone.comcast.net (68.86.93.185)  30.190 ms  100.740 ms  69.874 ms

 6  * * 23.30.206.166 (23.30.206.166)  52.093 ms

 7  po2-10g.ar8.nyc1.gblx.net (67.16.137.98)  50.148 ms  43.071 ms

    te4-3-10g.ar8.nyc1.gblx.net (67.16.143.26)  57.416 ms

 8  hurricane-electric-llc-new-york.tengigabitethernet1-3.ar5.nyc1.gblx.net (64.209.92.98)  70.405 ms  78.584 ms  57.481 ms

 9  10ge3-1.core1.nyc6.he.net (184.105.222.82)  67.895 ms  57.869 ms  61.966 ms

10  teljet-longhaul-llc.10gigabitethernet1-3.core1.nyc6.he.net (216.66.30.118)  142.279 ms  170.087 ms  494.677 ms

11  v12.te-1-1.core1.burlvt.teljet.net (64.25.208.186)  55.829 ms  224.185 ms  64.438 ms

12  ppp-64-25-209-165.teljet.com (64.25.209.165)  74.102 ms  70.441 ms  80.518 ms


What does this have to do with Net Neutrality and networks like Comcast? If Comcast customers start to use a lot of traffic out of the Comcast network, it will start to look lopsided to the networks Comcast peers with. Once Comcast starts to send a lot of traffic out to other places in the world, they start being something other than a prized eyeball network. They start needing other network providers to pass traffic out to the rest of the world. They are no longer a peer, they are just another transit customer and that means they might need to start paying for their connections to other networks. It helps them keep their network costs down when they limit the amount of traffic you can send out. The same goes for providers like Verizon and Fairpoint who offer DSL. From a technical standpoint, there is no reason why you couldn’t have the same amount of bandwidth going out as going in, but it’s more beneficial for your provider if you are simply an eyeball. They can sell your eyeballs to other providers to get free connections to the rest of the world. 

Another problem is that the Internet is changing. Services available today like Netflix, Amazon, Skype and even making use of Apple products require a lot of bandwidth. The world is moving to the cloud and the cloud requires that you have a lot of readily available bandwidth. In the early days of consumer-based service providers you had companies like AOL, CompuServe, NetZero and several others that offered Internet access to people. These companies were in the business of providing Internet access and in many cases that’s all they did. Now, the cable companies in the US have captured a huge share of the consumer market for Internet access. Services like YouTube, Netflix and many others use a lot of bandwidth. These services are in competition with the core business of your provider — providing televisual services to you. Charging you a lot of money for television and hardware and other similar services related to cable television is how these companies make a lot of money. Internet access doesn’t make them nearly as much. Once they start to lose customers of their cable services to Internet-based services like Netflix, YouTube and Hulu, they will need to make more money from their Internet services. 

The same is true of a company like Verizon. Verizon makes money from offering phone services. When you start making use of services like Vonage, MagicJack and Skype, not to mention Google Hangouts and other similar services, you start to cut into the revenue stream the company makes from their telephone services. Again, you aren’t paying much for Internet access. Certainly not enough to offset the revenue they make from their telephone services. 

We’re back to Net Neutrality. When these companies reach the breaking point where they are making less money from their cash cow businesses, they will need a way to offset that. Without a rule to keep providers from discriminating over traffic, these providers can start blocking their competing services and then forcing you to pay higher rates to get those services back. Net Neutrality keeps the playing field level but it does even more than that. In many if not most cases, you don’t have much of a choice for an Internet provider because cable companies have monopolies in their service areas and they managed to squeeze their competition out. I say cable providers but in some cases it’s companies like Verizon and AT&T offering television services over fiber. Without any other place to go, customers will be forced to pay the higher rates to continue their streaming services. Either that or the companies like Netflix will be forced to pay for the eyeballs and they will pass that cost along to their customers. 

Is Net Neutrality an important concept? Yes, it is. We run the risk of continuing to marginalize a service that is opening up the world for a lot of people. When people have to pay a lot of money for Internet service, they will drop to lower levels which will prevent companies from developing better services because they won’t have customers that can make use of them. This is the fear that led to Net Neutrality. Congress won’t regulate in part because the cable companies have lobbyists with deep pockets and a lot of influence. The courts say the FCC can’t because it oversteps its boundaries. That doesn’t leave anyone who may be able to protect customers and ensure the Internet is a place for innovation and progress.